11: Machine Learning System Design
Machine learning systems design
- In this section we'll touch on how to put together a system
- Previous sections have looked at a wide range of different issues in significant focus
- This section is less mathematical, but material will be very useful none-the-less
- Consider the system approach
- You can understand all the algorithms, but if you don't understand how to make them work in a complete system that's no good!
Prioritizing what to work on - spam classification example
- The idea of prioritizing what to work on is perhaps the most important skill programmers typically need to develop
- It's so easy to have many ideas you want to work on, and as a result do none of them well, because doing one well is harder than doing six superficially
- So you need to make sure you complete projects
- Get something "shipped" - even if it doesn't have all the bells and whistles, that final 20% getting it ready is often the toughest
- If you only release when you're totally happy you rarely get practice doing that final 20%
- So, back to machine learning...
- It's so easy to have many ideas you want to work on, and as a result do none of them well, because doing one well is harder than doing six superficially
- Building a spam classifier
- Spam is email advertising
Spam (y = 1)
From: cheapsales@buystufffromme.com
To: ang@cs.stanford.edu
Subject: Buy now!

Deal of the week! Buy now!
Rolex w4tchs - $100
Med1cine (any kind) - $50
Also low cost M0rgages available.
Non-spam (y = 0)
From: Alfred Ng
To: ang@cs.stanford.edu
Subject: Christmas dates?

Hey Andrew,
Was talking to Mom about plans
for Xmas. When do you get off
work. Meet Dec 22?
Alf
The misspellings are deliberate — w4tchs and Med1cine are underlined on the slide, and M0rgages is a third. Substituting digits for letters is how spam gets past a filter that matches on exact words, which is exactly why “misspelled word” is proposed as a feature on the next slide.
- What kind of features might we define
- Spam (1)
- Misspelled word
- Not spam (0)
- Real content
- Spam (1)
- How do we build a classifier to distinguish between the two
- Feature representation
- How do we represent x (features of the email)?
- y = spam (1) or not spam (0)
- How do we represent x (features of the email)?
- Feature representation
One approach - choosing your own features
- Choose 100 words which are indicative of an email being spam or not spam
- Spam --> e.g. buy, discount, deal
- Non spam --> Andrew, now
- All these words go into one long vector
- Encode this into a reference vector
- See which words appear in a message
- Define a feature vector x
- Which is 0 or 1 if a corresponding word in the reference vector is present or not
- This is a bitmap of the word content of your email
- i.e. don't recount if a word appears more than once
One entry per word in the reference vocabulary, set to 1 if that word appears anywhere in the email and 0 if it does not. It is a bitmap, not a count — a word appearing five times still contributes a single 1.
- In practice it's more common to have a training set and pick the most frequent n words, where n is 10 000 to 50 000
- So here you're not specifically choosing your own features, but you are choosing how you select them from the training set data
- Which is 0 or 1 if a corresponding word in the reference vector is present or not
What's the best use of your time to improve system accuracy?
- Natural inclination is to collect lots of data
- Honey pot anti-spam projects try and get fake email addresses into spammers' hands, collect loads of spam
- This doesn't always help though
- Develop sophisticated features based on email routing information (contained in email header)
- Spammers often try and obscure origins of email
- Send through unusual routes
- Develop sophisticated features for message body analysis
- Discount == discounts?
- DEAL == deal?
- Develop sophisticated algorithm to detect misspelling
- Spammers use misspelled word to get around detection systems
- Often a research group randomly focus on one option
- May not be the most fruitful way to spend your time
- If you brainstorm a set of options this is really good
- Very tempting to just try something
Error analysis
- When faced with a ML problem lots of ideas of how to improve a problem
- Talk about error analysis - how to better make decisions
- If you're building a machine learning system often good to start by building a simple algorithm which you can implement quickly
- Spend at most 24 hours developing an initially bootstrapped algorithm
- Implement and test on cross validation data
- Plot learning curves to decide if more data, features etc will help algorithmic optimization
- Hard to tell in advance what is important
- Learning curves really help with this
- Way of avoiding premature optimization
- We should let evidence guide decision making regarding development trajectory
- Error analysis
- Manually examine the samples (in cross validation set) that your algorithm made errors on
- See if you can work out why
- Systematic patterns - help design new features to avoid these shortcomings
- e.g.
- Built a spam classifier with 500 examples in CV set
- Here, error rate is high - gets 100 wrong
- Manually look at 100 and categorize them depending on features
- e.g. type of email
- Looking at those emails
- May find most common type of spam emails are pharmacy emails, phishing emails
- See which type is most common - focus your work on those ones
- What features would have helped classify them correctly
- e.g. deliberate misspelling
- Unusual email routing
- Unusual punctuation
- May find some "spammer technique" is causing a lot of your misses
- Guide a way around it
- May find most common type of spam emails are pharmacy emails, phishing emails
- Built a spam classifier with 500 examples in CV set
- Importance of numerical evaluation
- Have a way of numerically evaluating the algorithm
- If you're developing an algorithm, it's really good to have some performance calculation which gives a single real number to tell you how well it's doing
- e.g.
- Say we're deciding if we should treat a set of similar words as the same word
- This is done by stemming in NLP (e.g. "Porter stemmer" looks at the etymological stem of a word)
- This may make your algorithm better or worse
- Also worth considering weighting error (false positive vs. false negative)
- e.g. is a false positive really bad, or is it worth having a few of one to improve performance a lot
- Also worth considering weighting error (false positive vs. false negative)
- Can use numerical evaluation to compare the changes
- See if a change improves an algorithm or not
- A single real number may be hard/complicated to compute
- But makes it much easier to evaluate how changes impact your algorithm
- You should do error analysis on the cross validation set instead of the test set
- Spend at most 24 hours developing an initially bootstrapped algorithm
Error metrics for skewed classes
- One case where it's hard to come up with good error metric - skewed classes
- Example
- Cancer classification
- Train logistic regression model hθ(x) where
- Cancer means y = 1
- Otherwise y = 0
- Test classifier on test set
- Get 1% error
- So this looks pretty good..
- But only 0.5% have cancer
- Now, 1% error looks very bad!
- Get 1% error
- Train logistic regression model hθ(x) where
- So when one number of examples is very small this is an example of skewed classes
- LOTS more of one class than another
- So standard error metrics aren't so good
- Cancer classification
- Another example
- Algorithm has 99.2% accuracy
- Make a change, now get 99.5% accuracy
- Does this really represent an improvement to the algorithm?
- Did we do something useful, or did we just create something which predicts y = 0 more often
- Get very low error, but classifier is still not great
Precision and recall
- Two new metrics - precision and recall
- Both give a value between 0 and 1
- Evaluating classifier on a test set
- For a test set, the actual class is 1 or 0
- Algorithm predicts some value for class, predicting a value for each example in the test set
- Considering this, classification can be
- True positive (we guessed 1, it was 1)
- False positive (we guessed 1, it was 0)
- True negative (we guessed 0, it was 0)
- False negative (we guessed 0, it was 1)
- Considering this, classification can be
- Precision
- How often does our algorithm cause a false alarm?
- Of all patients we predicted have cancer, what fraction of them actually have cancer
- = true positives / # predicted positive
- = true positives / (true positive + false positive)
- High precision is good (i.e. closer to 1)
- You want a big number, because you want false positive to be as close to 0 as possible
- Recall
- How sensitive is our algorithm?
- Of all patients in set that actually have cancer, what fraction did we correctly detect
- = true positives / # actual positives
- = true positive / (true positive + false negative)
tp, fp, fn = 80, 20, 40   # counts from a classifier's test run

P = tp / (tp + fp)        # 0.8   - of everything we called 1, how much was
R = tp / (tp + fn)        # 0.667 - of everything that was 1, how much we found
2 * P * R / (P + R)       # 0.727 - the F1 score, defined in the next section
Precision and recall from raw counts — the two definitions above, one line each.
- High recall is good (i.e. closer to 1)
- You want a big number, because you want false negative to be as close to 0 as possible
- By computing precision and recall get a better sense of how an algorithm is doing
- This can't really be gamed
- Means we're much more sure that an algorithm is good
- Typically we say the presence of a rare class is what we're trying to determine (e.g. positive (1) is the existence of the rare thing)
Trading off precision and recall
- For many applications we want to control the trade-off between precision and recall
- Example
- Trained a logistic regression classifier
- Predict 1 if hθ(x) >= 0.5
- Predict 0 if hθ(x) < 0.5
- This classifier may give some value for precision and some value for recall
- Predict 1 only if very confident
- One way to do this is to modify the algorithm - we could modify the prediction threshold
- Predict 1 if hθ(x) >= 0.8
- Predict 0 if hθ(x) < 0.8
- Now we can be more confident a 1 is a true positive
- But classifier has lower recall - predict y = 1 for a smaller number of patients
- Risk of false negatives
- One way to do this is to modify the algorithm - we could modify the prediction threshold
- Another example - avoid false negatives
- This is probably worse for the cancer example
- Now we may set to a lower threshold
- Predict 1 if hθ(x) >= 0.3
- Predict 0 if hθ(x) < 0.3
- Predict 1 if hθ(x) >= 0.3
- i.e. 30% chance they have cancer
- So now we have a higher recall, but lower precision
- Risk of false positives, because we're less discriminating in deciding what means the person has cancer
- Now we may set to a lower threshold
- This is probably worse for the cancer example
- Trained a logistic regression classifier
- This threshold defines the trade-off
- We can show this graphically by plotting precision vs. recall
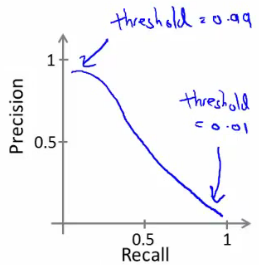
- This curve can take many different shapes depending on classifier details
- Is there a way to automatically choose the threshold
- Or, if we have a few algorithms, how do we compare different algorithms or parameter sets?
Three classifiers, each better on one measure than the others. Precision (P) Recall (R) Algorithm 1 0.5 0.4 Algorithm 2 0.7 0.1 Algorithm 3 0.02 1.0
- Or, if we have a few algorithms, how do we compare different algorithms or parameter sets?
- How do we decide which of these algorithms is best?
- We spoke previously about using a single real number evaluation metric
- By switching to precision/recall we have two numbers
- Now comparison becomes harder
- Better to have just one number
- How can we convert P & R into one number?
- One option is the average - (P + R)/2
- This is not such a good solution
- Means if we have a classifier which predicts y = 1 all the time you get a high recall and low precision
- Similarly, if we predict Y rarely get high precision and low recall
- So averages here would be 0.45, 0.4 and 0.51
- 0.51 is best, despite having a recall of 1 - i.e. predict y=1 for everything
- So average isn't great
- This is not such a good solution
- F1Score (fscore)
import numpy as np

P = np.array([0.5, 0.7, 0.02])   # the three algorithms in the table above
R = np.array([0.4, 0.1, 1.0])

(P + R) / 2          # [0.45, 0.4, 0.51]   - the average picks algorithm 3
2 * P * R / (P + R)  # [0.444, 0.175, 0.039] - F1 picks algorithm 1
The table above, scored both ways. Averaging rewards the predict-1-for-everything classifier; the F1 score puts it last, which is the point.
- Fscore is like taking the average of precision and recall giving a higher weight to the lower value
- Many formulas for computing comparable precision/accuracy values
- If P = 0 or R = 0 the Fscore = 0
- If P = 1 and R = 1 then Fscore = 1
- The remaining values lie between 0 and 1
- One option is the average - (P + R)/2
- We can show this graphically by plotting precision vs. recall
- Threshold offers a way to control trade-off between precision and recall
- Fscore gives a single real number evaluation metric
- If you're trying to automatically set the threshold, one way is to try a range of threshold values and evaluate them on your cross validation set
- Then pick the threshold which gives the best fscore.
- If you're trying to automatically set the threshold, one way is to try a range of threshold values and evaluate them on your cross validation set
Data for machine learning
- Now switch tracks and look at how much data to train on
- On early videos caution on just blindly getting more data
- Turns out under certain conditions getting more data is a very effective way to improve performance
Designing a high accuracy learning system
- There have been studies of using different algorithms on data
- Data - confusing words (e.g. two, to or too)
- Algorithms
- Perceptron (logistic regression)
- Winnow
- Like logistic regression
- Used less now
- Memory based
- Used less now
- Talk about this later
- Naive Bayes
- Covered in chapter 05
- Varied training set size and tried algorithms on a range of sizes
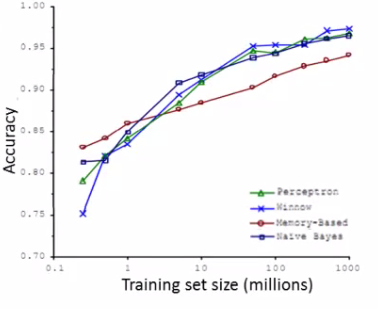
- What can we conclude
- Algorithms give remarkably similar performance
- As training set sizes increases accuracy increases
- Take an algorithm, give it more data, should beat a "better" one with less data
- Shows that
- Algorithm choice is pretty similar
- More data helps
- When is this true and when is it not?
- If we can correctly assume that features x have enough information to predict y accurately, then more data will probably help
- A useful test to determine if this is true can be, "given x, can a human expert predict y?"
- So lets say we use a learning algorithm with many parameters such as logistic regression or linear regression with many features, or neural networks with many hidden units
- These are powerful learning algorithms with many parameters which can fit complex functions
- Such algorithms are low bias algorithms
- Little systemic bias in their description - flexible
- Such algorithms are low bias algorithms
- Use a small training set
- Training error should be small
- Use a very large training set
- If the training set error is close to the test set error
- Unlikely to over fit with our complex algorithms
- So the test set error should also be small
- These are powerful learning algorithms with many parameters which can fit complex functions
- Another way to think about this is we want our algorithm to have low bias and low variance
- Low bias --> use complex algorithm
- Low variance --> use large training set
- If we can correctly assume that features x have enough information to predict y accurately, then more data will probably help